As of Friday's market close of $164.05, AAPL is trading at a 15.1x multiple on my next-twelve-months EPS estimate (12.0x when excluding next-12m net cash and div).
I decided to challenge myself by posting my final estimates nearly two months instead of the usual two weeks or so before the report because the events during these two months (keynote, launch, ramp, and report) appear to be some of the most influential for Apple in years, with significant details like precise launch timing, product pricing, reception and supply sufficiency, all helpful in correctly estimating the final few days of Fiscal 2017, the initial shape of the much hyped 2018 supercycle, and a first glimpse into the sort of tough compare arguments looking into 2019 that inevitably will be raised as soon as Q1 guidance is provided (in fact this has already been happening).
It may seem counter-productive to attempt estimates before all the critical events and information are in the past and can get digested and distilled into my model. Why not just do as usual and incorporate it all in mid October? There'd be absolutely no risk to the accuracy of my final estimates by waiting. On the contrary, coming out early leaves the forecast at the mercy of some of my most subjective, perhaps some conservative, others more hopeful, and possibly even a few strained assumptions. Like, what if the launch is on the last two days of Q4 and not the week before? Or what if Apple announces record-smashing pre-orders or sales that would clearly call for adjustments in both Q4 and Q1 numbers? Or if the event disappoints some tech pundits who take it to the interwebs with rage against Apple? (Ok that one's a given, of course.) Maybe some manufacturing glitch turns up in early October and phones start blowing up in flames? OMG! (Even though Samsung came out nearly unscathed from that, Apple would be crucified. But no, that won't happen.) Or, they call it the iFacePhone? *facepalm*
But seriously, why not get all the possible facts available before the report? Well, that's precisely what I wanted to test about my model and assumptions, and no better opportunity than these two months before this special supercycle. I wanted to test the value of those assumptions and whether the forecast is fragile or robust against uncertainty, when lacking the objective factual details, but rather based on relatively consistent yet subjective patterns, perceptions, hunches, and usually vague but pretty sensible (and most essential IMO) notions of management style, strategy, priorities, and cultural values. Patterns, hunches, and notions which I hardly ever share or explain at length (and I still won't) because opinions are cheap and thus only the most facile, snarky, clickbait-ish, or plain-out nasty are the ones that get attention (helped by both its proponents and detractors), and there's never any accountability for all this incredibly prolific but wasteful punditry. Even the hard cold, mostly non-opinionated sell-side analyst numbers looking forward 1 or 2 years are never judged or even tested after the facts are known, with the latest single-quarter revisions shouldering the sole opportunity for establishing any confidence in the cacophony of pivotal, usually existential, long-term judgments and predictions.
Oops, a bit of a tangential rant there. Anyway, if I think I can somehow model Apple's business 2-3 years or even further in advance and hope to do it somewhat reliably, it would only be thanks to precisely this kind of intuitive grasp of the company, and not just by being knowledgeable about the launch date or the exact pricing or the silly name or the precise unlocking mechanism of the premium phone. Much less by carefully monitoring how far WS analysts raise their estimates right up to the day of the report so one can align guesses around or just ahead of their herd-like behavior. No, the added value I aim to provide is not attained by waiting to collect all the info possible and after all the events and knowable facts are known, only then produce an estimate, the best-informed one can produce. Because contrary to what financial reporting (even the good bits out there) would suggest, the goal is not at all to come up with the best prediction for the latest three-month period, which in fact has minimal influence on the stock's valuation. Instead, it's to somehow develop a picture as realistic as possible of what the next 5-10 years will look like, this indeed representing the bulk of an investment's intrinsic value. So, my insights (or lack thereof) into that longer-term future can only be appreciated when I'm forced into baking-in some hunches and a lot of hopefully educated guesses into the model, and once some short-term events and outcomes that actually depend on some of these assumptions are revealed one may be able to assign the proper level of confidence for those longer-term projections which do inform the value of a company.
Ok enough justification on this crazy silly guessing game. In any case, I'll do whatever, and you should always do your own work, never assume I'm here to do it for you. In fact, assume I'm just trying to have fun. And nothing's more fun and rewarding than trying to guess the end-of-year stuff well before everything gets revealed, just like the joy of Christmas and Santa is all about basking in the build-up of expectations and the thrill of surprises.
Sorry for the long philosophical dissertation. On this specific forecast (see below), seems WS analysts should raise Q1 consensus once they see guidance, which will likely make them raise the rest of the year in tandem, up until the end of January when Q2 guidance is given. Then, that Q2 guidance could come as a slight miss (Q2-Q4 expectations already somewhat elevated well before a hypothetical reaction to Q1 guidance upside) and trigger a healthy reset on those expectations. Or perhaps I'm just a bit low and all will be good. We'll have to wait and see how these dynamics play out in October and January.
I'll spare you any additional commentary on the current and next quarters as there would be too much to cover, except for this which last time I promised to reiterate: Fiscal 2019 consensus estimates of at least mid single-digits growth seem key for continued stock appreciation. Those will be publicly available in financial sites after Q4 gets reported (likely on Oct 31). Of course, Dec quarter guidance given that same day is immensely important, but everyone already knows this. Right? Ok. Just remember to also get a peek at 2019 estimates then, and maybe allow a couple weeks for analysts' model updates to trickle through the data services to see how these evolve early on.
Remember, those 2019 expectations will be the basis of a "tough compare" bearish case brought up against Apple, just as in the 2015 top, and unless tax reform gets passed or double-digit growth from the supercycle prolongs into 2019 (a reasonable possibility), it'll surely play a role against investor's confidence in the company's mid-term prospects.
Detailed estimates:
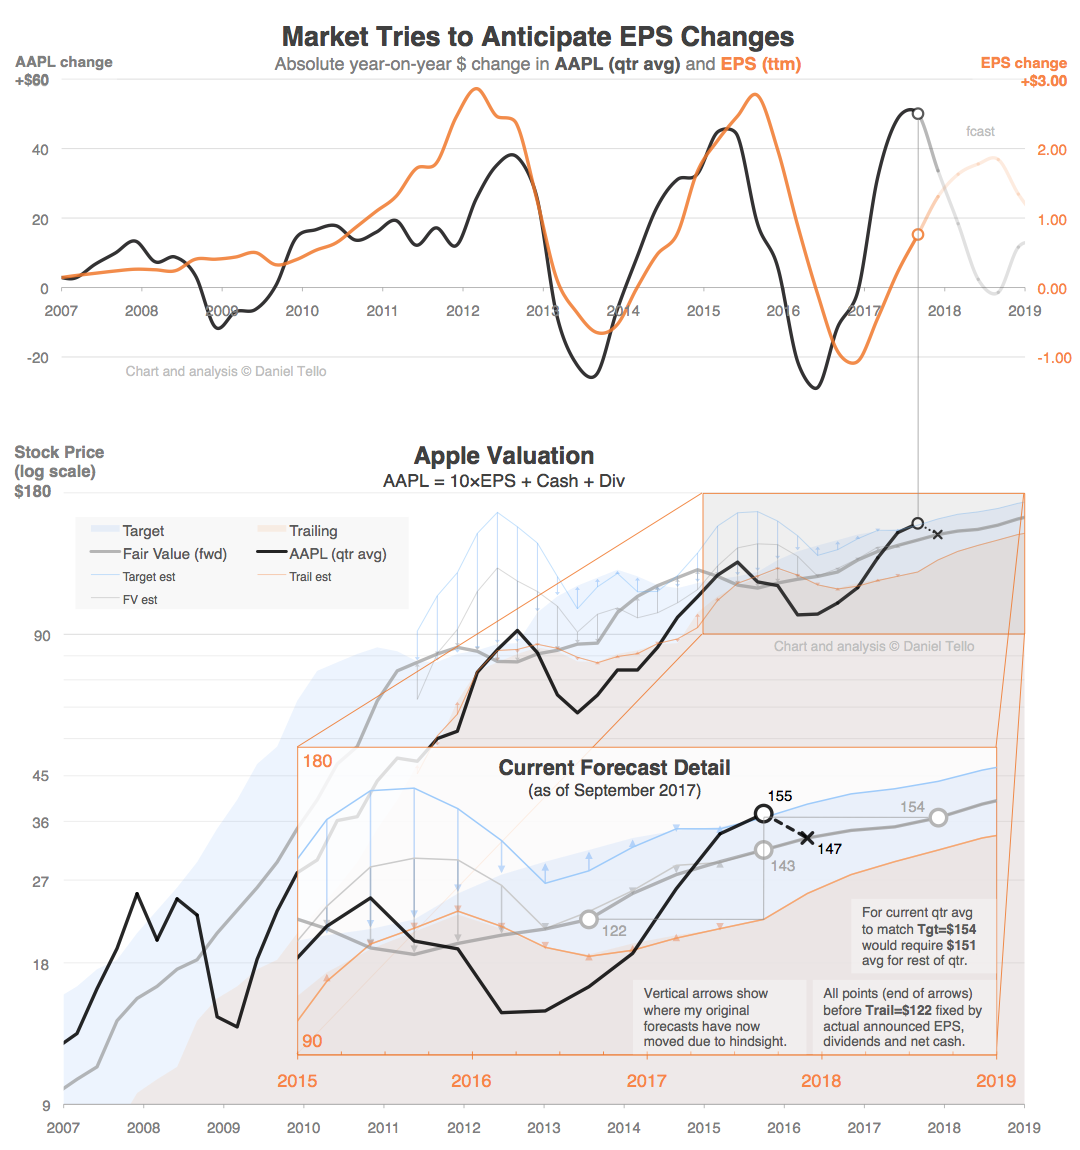
3mo ending Sep-2017  Rev($M)  GM(%)  EPS($)
-------------------  -------  -----  ------
Analysts consensus    51,090      -   1.88
Apple guide low       49,000   37.5   1.75*
Apple guide high      52,000   38.0   1.93*
My estimates          51,574   38.1   1.92 (5.19b shares)


3mo ending Dec-2017  Rev($M)  GM(%)   EPS($)
-------------------  -------  -----   ------
Analysts consensus    86,860      -    3.83
Apple guide low (e)   85,000   38.0    3.69*
Apple guide high(e)   87,000   39.0    3.91*
My estimates          87,349   39.4    3.98 (5.13b shares)

*EPS guidance ranges derived from other figures provided
 by Apple and diluted shares outstanding estimated by me


12m ending Sep-2018  Rev($M)  EPS($)
-------------------  -------  ------
Analysts consensus   261,980   10.88
My estimates         259,669   10.88


Valuation (fwd-12mo from)  EPS($)   Y/Y  10x  Cash*  Div  Tot
-------------------------  ------  ----  ---  ----  ----  ---
Trailing       (Oct-2016)    9.04    9%   90    29  2.40  122
Fair Value     (Oct-2017)   10.88   20%  109    31  2.64  143
1yr Target     (Oct-2018)   11.46    5%  115    36  2.96  154

* Cash per share balance net of long-term debt
(click to enlarge)
F4Q17 Revenue breakdown:
iPhone    30,041 (47.5 × $632)
iPad       4,541 (10.5 × $432)
Mac        6,666 (5.05 × $1,320)
Services   7,548
Other      2,742 ( 3.0 × $391 = 1,172 Watch)

Income statement:
Revenue   51,574
COGS     (31,928)
GM        19,647  38.1%

OpEx     ( 6,784)
OpInc     12,863  24.9%

OIE          505
Pre-tax   13,368

Tax      ( 3,409) 25.5%
NetInc     9,959  19.3%

Shares     5,189
EPS        $1.92

(amounts in millions except $ASP, $EPS, and ratios%)


3 comments:
I for one appreciate you coming out earlier with you estimates. However, in this particular special 10th anniversary product cycle and the apparent demand for iPhone X over the iPhone 8 and 8+, I don't see apple stock (value) receding in early 2018, once the demand for the higher ASP iPhone X becomes known. I also believe that the cyclic nature of EPS will flatten due to the subscription and installment plans that are now prevalent. I truly believe that the demographic that is buying the most iPhones look at monthly cost and are not that concerned about the 12, 24 or 36 month total cost when deciding to purchase. To my delight as an Apple investor, these types of financial arrangements hopefully will increase and smooth out earnings.
I would appreciate your thoughts.
Hi Harry, great comment, thanks for sharing.
You bring up very important points and I do believe a higher iPhone ASP represents the biggest potential for EPS upside to consensus estimates. For now I’m being cautious about FY 2018 ASP (a bit over $700) until we get a better idea of how mix evolves from Q4 2017 through Q2-Q3 2018 or so, when I think the iPhone X contribution to mix would be highest. Apple continuing to sell the 7 and even the 6s, and reducing the SE’s price show interesting dynamics into ASP, in addition to the 8’s and X and the shift in capacity brackets.
However, seeing 2018 consensus revenue estimates run up near $266b (from $255b 3 months ago), and many analysts stretching over $275b and at least one over $300b suggests to me not just this higher ASP potential but also strong >20% unit growth is already being priced-in, perhaps significantly, at least at the >$160 stock price levels. That’s the supercycle argument, already put in question by some pundits (in my view prematurely) based on perceived disappointments on both the 8 and the X models over the last few weeks.
The other part of the one-two 2018 punch I mentioned is the tax reform promise, which many don’t understand how to value, which I believe has contributed a significant (possibly excesive) premium for the last 6-9 months. I still remain very skeptical it’ll pass as promised this year or early next year, also leaving me slightly cautious on next year and beyond EPS vs. consensus. I’ll be very happy if some concrete announcements from management on tax policies force me to structurally revise the future long-term profitability (x10 value) rather than adding a one-time effect to cash (x1 value). Also, given that my current 1-2y projections call for a relatively flat return on the stock, the contribution of any acceleration of the capital return program is currently a bit muted, so any upside to my numbers would get compounded if combined by a significant capital return expansion, which again, I’m not currently modeling due to the less attractive return in the near future compared to the last several years. My concern is if tax reform passes and management decides to heed the advice of some analysts by betting most of the unlocked cash windfall on a huge buyback, and for whatever reason or the slightest glitch growth doesn’t occur in 2019, or we see a slight revenue decline as in 2016 and the market panics again, the huge repuchase would be seen as a complete waste, or at least for several years as an expensive, money-losing, and artificial boost to EPS. For now my model says buybacks are neutral at thiese prices, so it currently suggests instead a more measured approach by using a significant portion of the cash to pay off the debt.
(continues…)
Finally (this response already too long-winded, sorry) the decline to $147 in the current quarter called for the model isn’t an inevitable fate, nor should it be any meaningful concern at all for any reasonable long-term investor (traders might think differently), given that the mid-term slope is still positive. The question for each individual investor is how positive a slope they require to compensate for the risk of riding the well-known AAPL rollercoaster, not for the faint of heart given implied annual volatility of about 25% and known drawdowns of 40-60% completely driven by sentiment or on the slightest fundamental weakness. I’ll share some more numbers along that projected FV curve on my valuation chart but understand it should be interpreted as a rough general wayline akin to sailing along changing sea currents and wind condidtions rather than a fixed train track over unmovable land. The gray FV line currently calls for $147 (current quarter avg), $150, $152, $154 (Sep’18 or 1y target avg), and $159 to end the year (would be my 1y target if next week report meets my expectations). So, if the market followed that path to the t, which it certainly won’t, the current stock price is pretty neutral, slight decline now but end at a slight upside.
On the other hand, the market can justifiably remain around the top blueish 1y-target curve ($160-175) in my valuation chart for a while, given the current optimism. Or it could stay flat and meet the gray FV line in 9 months or so, and resume its upward trajectory once some of the current uncertainty arround such optimism gets resolved. Or it could tank to $135 or worse in the short term if the supercycle and tax reform narratives begin to fall apart, but that’d surely be a great buying opportunity. In any case, only traders should worry about all these tribulations. Until the average stock price falls meaningfully above the blueish area, or unless one day I post a flat or downward-sloping gray FV line, and the blue area of targets falls below that gray line, indicating mid-term projected declines over 2 years, I wouldn’t worry.
Sorry for the length, and again thanks for commenting. Good luck!
Post a Comment