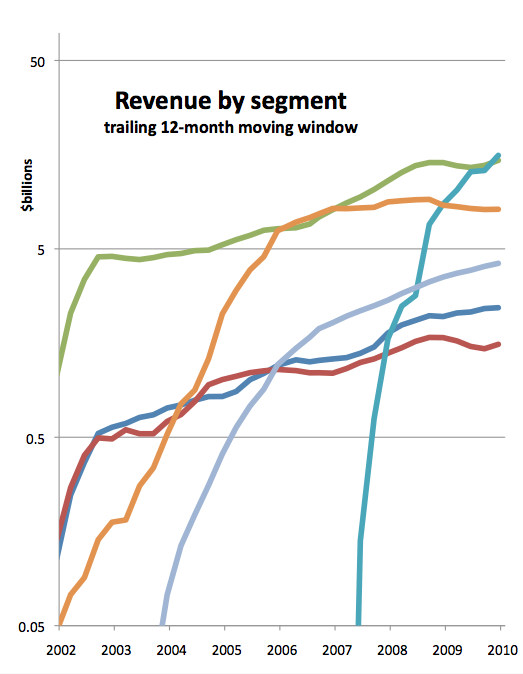

First thing you should notice is the log scale. Second, you don't get a legend for the colored lines. Ha! [Update: game over, see the 10 year projection above] It occurred to me as a fun and educational research activity to leave it like that and let you work out which color is which product segment. It shouldn't be hard if you remember your Apple products history. And as an incentive, I'll send you the continuation of the graph with my estimates for the next 10 years (yea I know 10 years is crazy but whatever) if you email me the correct color/product matching. Don't spoil it for others in the comments, please!
Enjoy!
-d
Update:
Well, 15 readers have played along and correctly cracked the color key (with just a little help for a few), and are enjoying the prize. The toughest part seems to be how to name those colors! Blame it on the mischievous guys and gals from the MacBU at Microsoft for picking those default colors for charts in Excel for Mac.
These were the names readers used for just two of them:
teal, turquoise, blue-green, light blue, bright blue, mid-tone blue (teal)
gray, blueish gray, light blue, light purple, purple, lightest blue (lavender?)
Yikes! I wonder what they called them at the MacBU. Probably something impossible like 'Blue Chill' and 'Blue Haze'.
Good job everyone. And if anyone's stuck... get a clue already. :P
Earnings estimates tomorrow afternoon (Tuesday).





 Posts
Posts

